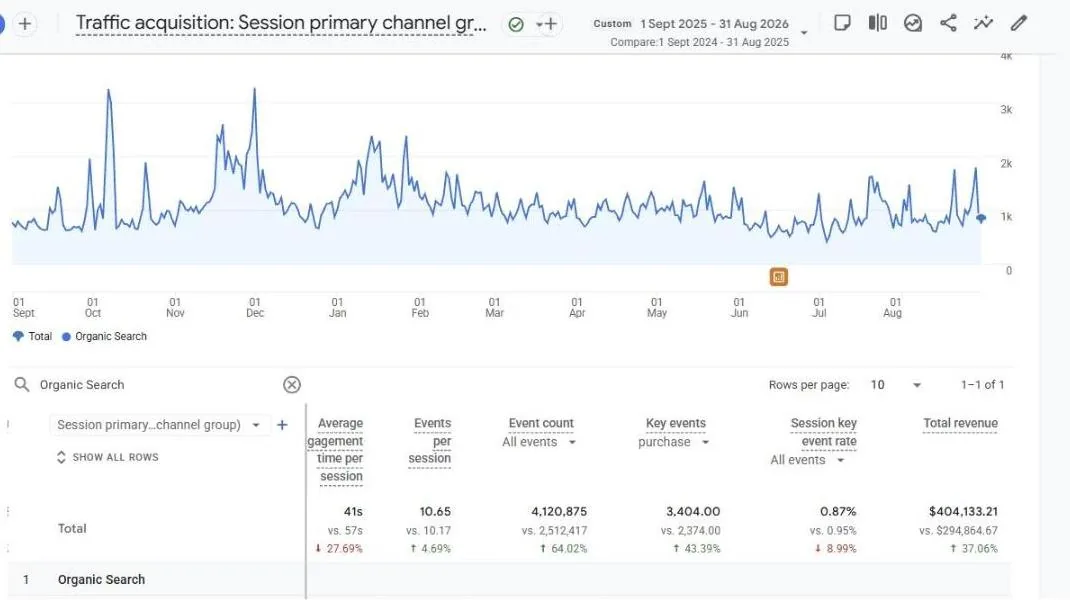
Organic revenue up 37%, straight through a Google core update
Two years of SEO for a premium health category brand, shown in full: the data, the diagnosis, the work, and what comes next.
Figures from the brand's own GA4, Google Search Console, SEO Gets and LLMrefs, pulled September 2026. Brand details withheld.
A premium health category brand, Shopify, US-led
The brand
Direct-to-consumer, premium price point, US-led with international buyers. Paid-led marketing, with organic search as the long-term channel.
Our scope, 2+ years
Store pages, content, technical SEO, AI search visibility, analytics and monthly revenue-first reporting.
The 2026 test
Google's May core update halved informational blog visibility, AI answers changed search, and a site redesign began.
Organic revenue and purchases: GA4 Organic Search channel, Sep 2025 to Aug 2026 vs Sep 2024 to Aug 2025. Product clicks: Search Console, 25 Aug to 21 Sep 2026 vs 26 Aug to 22 Sep 2025. Conversions: SEO Gets, 25 Jun to 23 Sep 2026 vs prior 3 months. AI: Search Console generative AI report, 3 months to 21 Sep 2026.
Organic revenue up 37% on the previous 12 months
Peak season: Q4 revenue up 69%, November up 115%
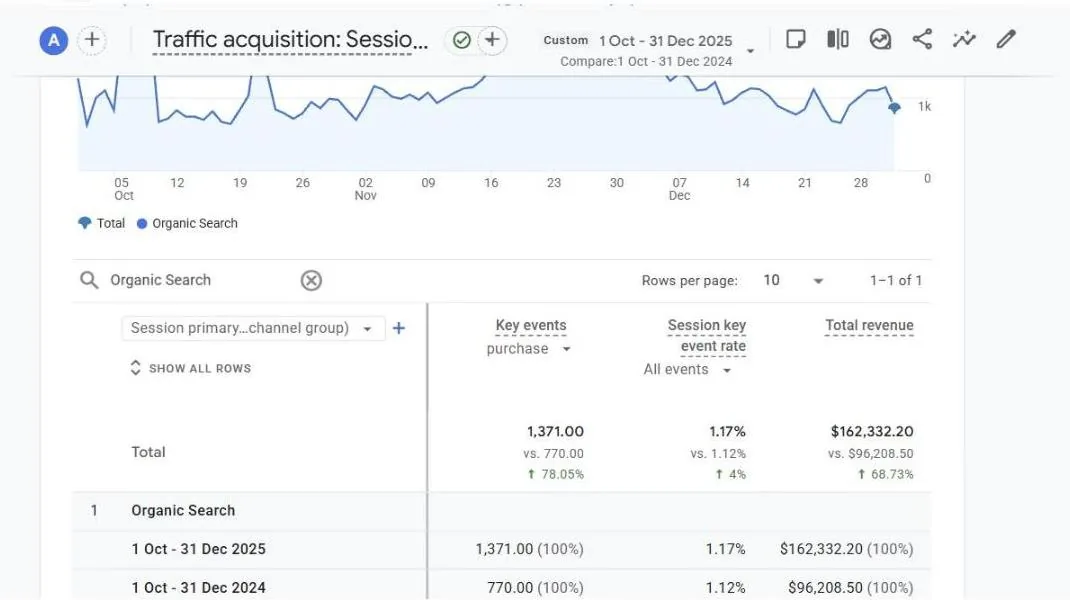
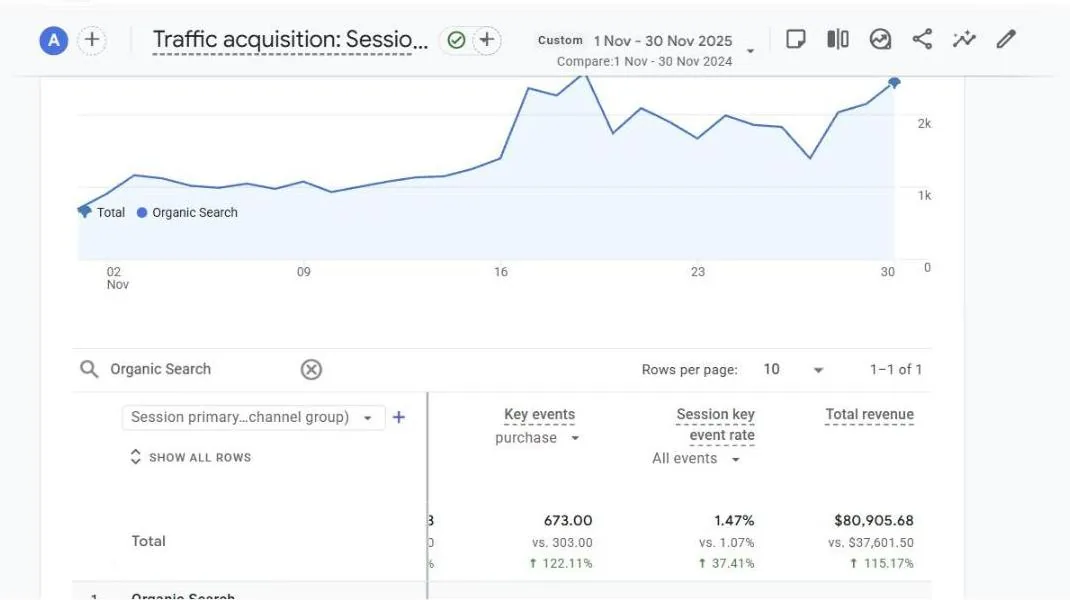
GA4 Organic Search channel. Captured 2 Oct 2026; account name blurred.
After the core update: the last 3 months still up
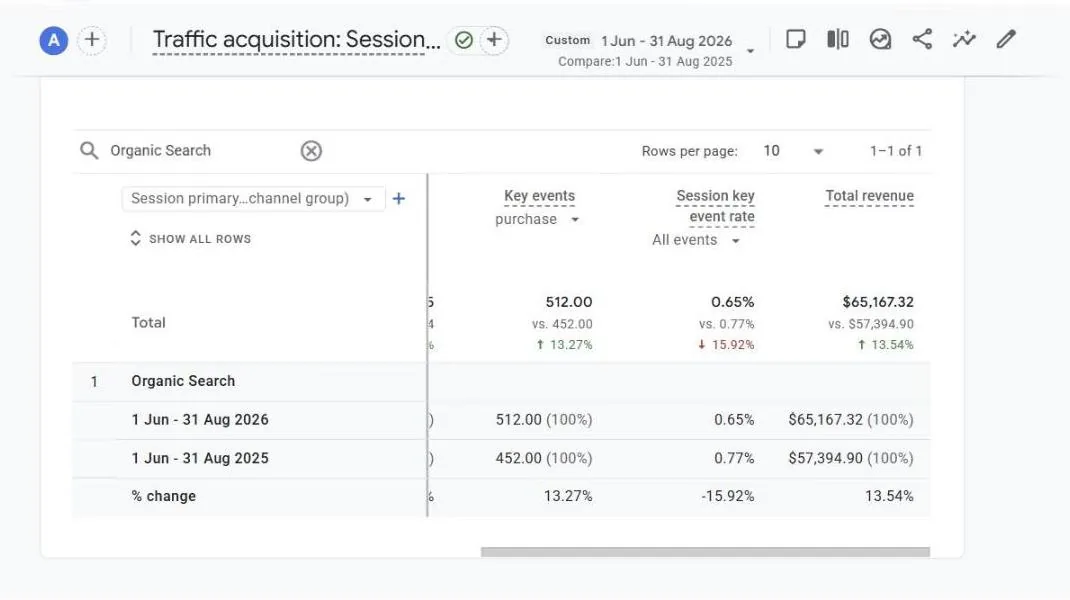
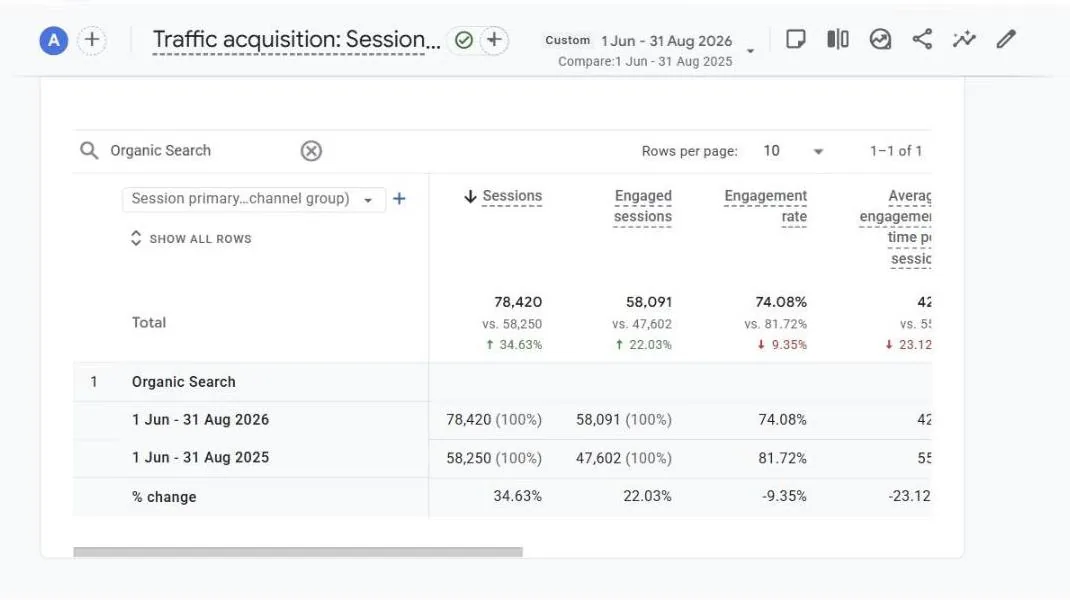
GA4 Organic Search channel, 1 Jun to 31 Aug 2026 vs 1 Jun to 31 Aug 2025. Captured 2 Oct 2026; account name blurred.
Google search revenue, the same 28 days a year apart: up 30%
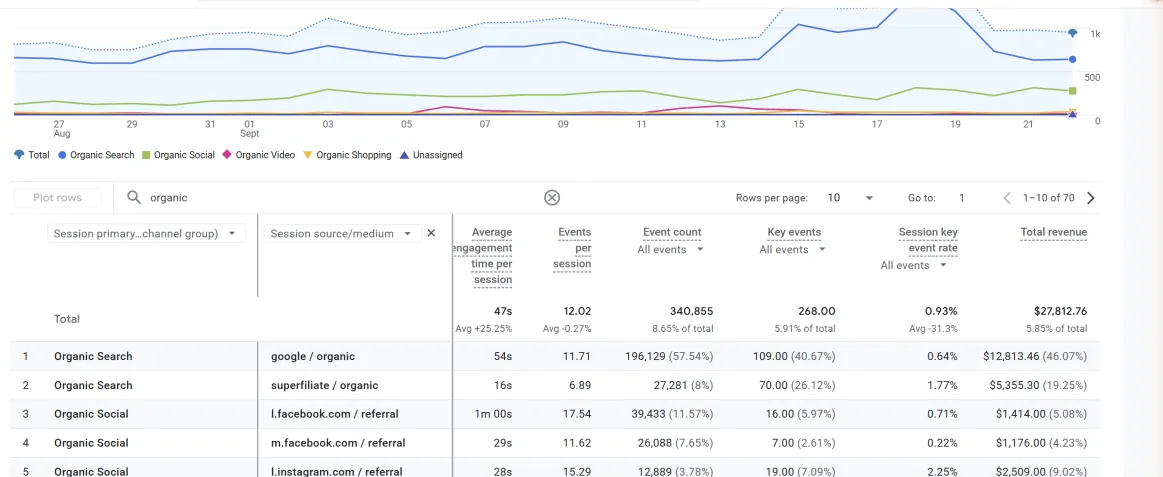
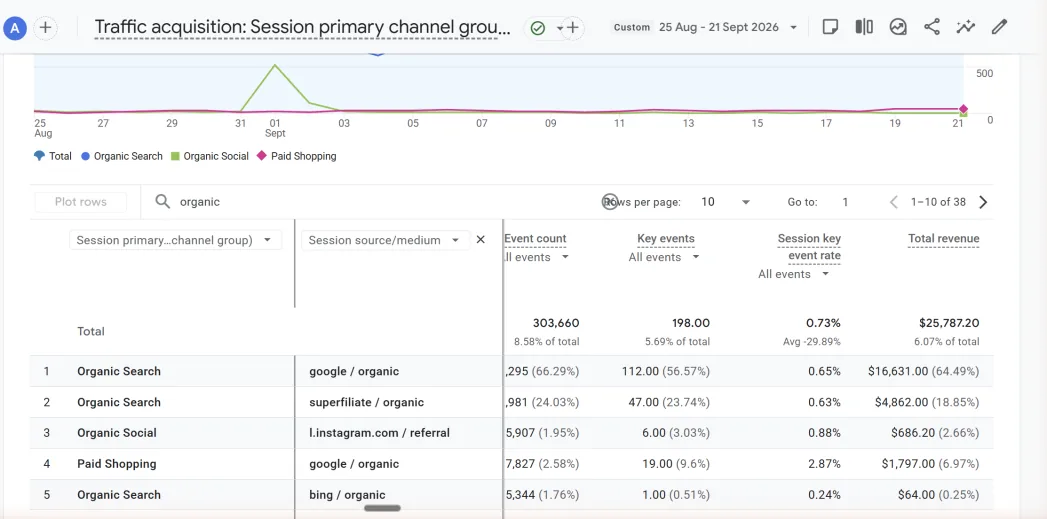
Row 1 in each screenshot is Google web search. With Google's free Shopping listings added (filed under Paid Shopping), the totals are $14,067 and $18,428, up 31%.
GA4 Traffic acquisition by session source / medium, filtered to organic. Captured 25 Sep 2026; account name blurred.
The growth came from the pages that sell
| Page type | A year earlier | Now | Change |
|---|---|---|---|
| Product pages | 909 | 1,752 | +93% |
| Collection pages | 910 | 1,383 | +52% |
| Product and collection pages | 1,819 | 3,135 | +72% |
| Homepage | 2,494 | 2,260 | −9% |
| Blog posts | 11,202 | 7,201 | −36% |
Branded searches grew too: 2,427 to 2,702 clicks (+11%).
Biggest commercial gains
The hero product page now ranks around position 3 for the category's biggest search term.
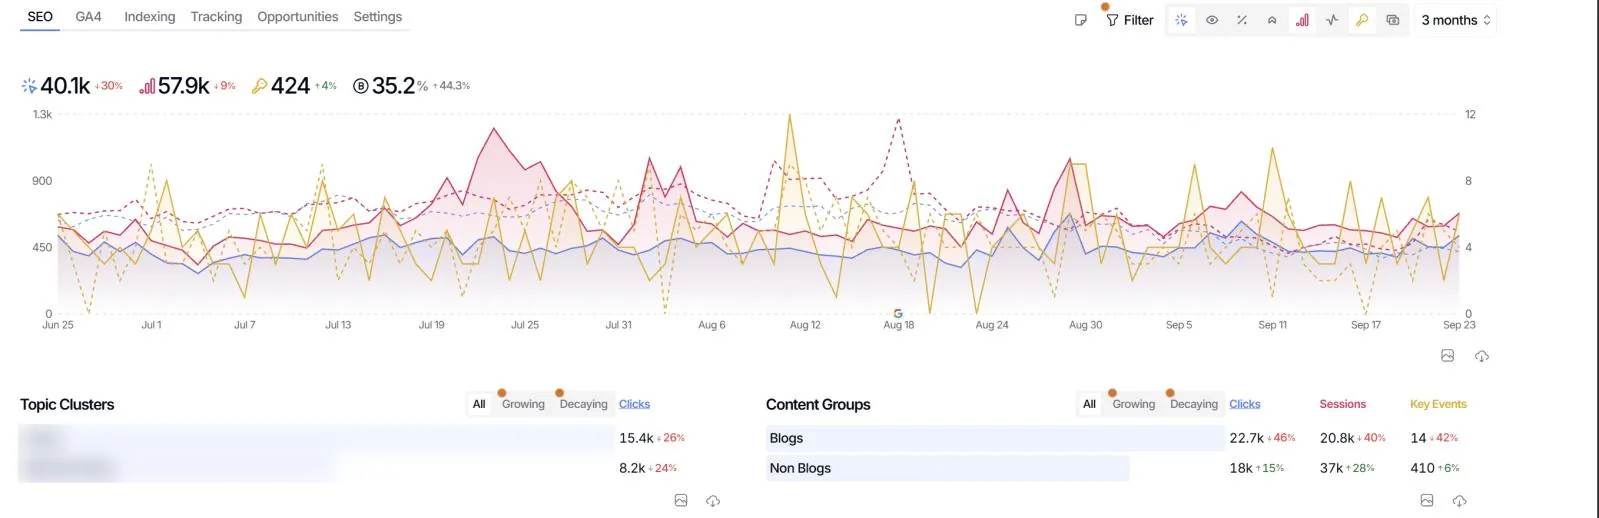
Google Search Console, 25 Aug to 21 Sep 2026 vs 26 Aug to 22 Sep 2025, product URL variants merged. Head-term position: 2.82 average, same window.
Over three months, store pages grew while blog clicks fell
281K Google clicks and 29M impressions in 16 months
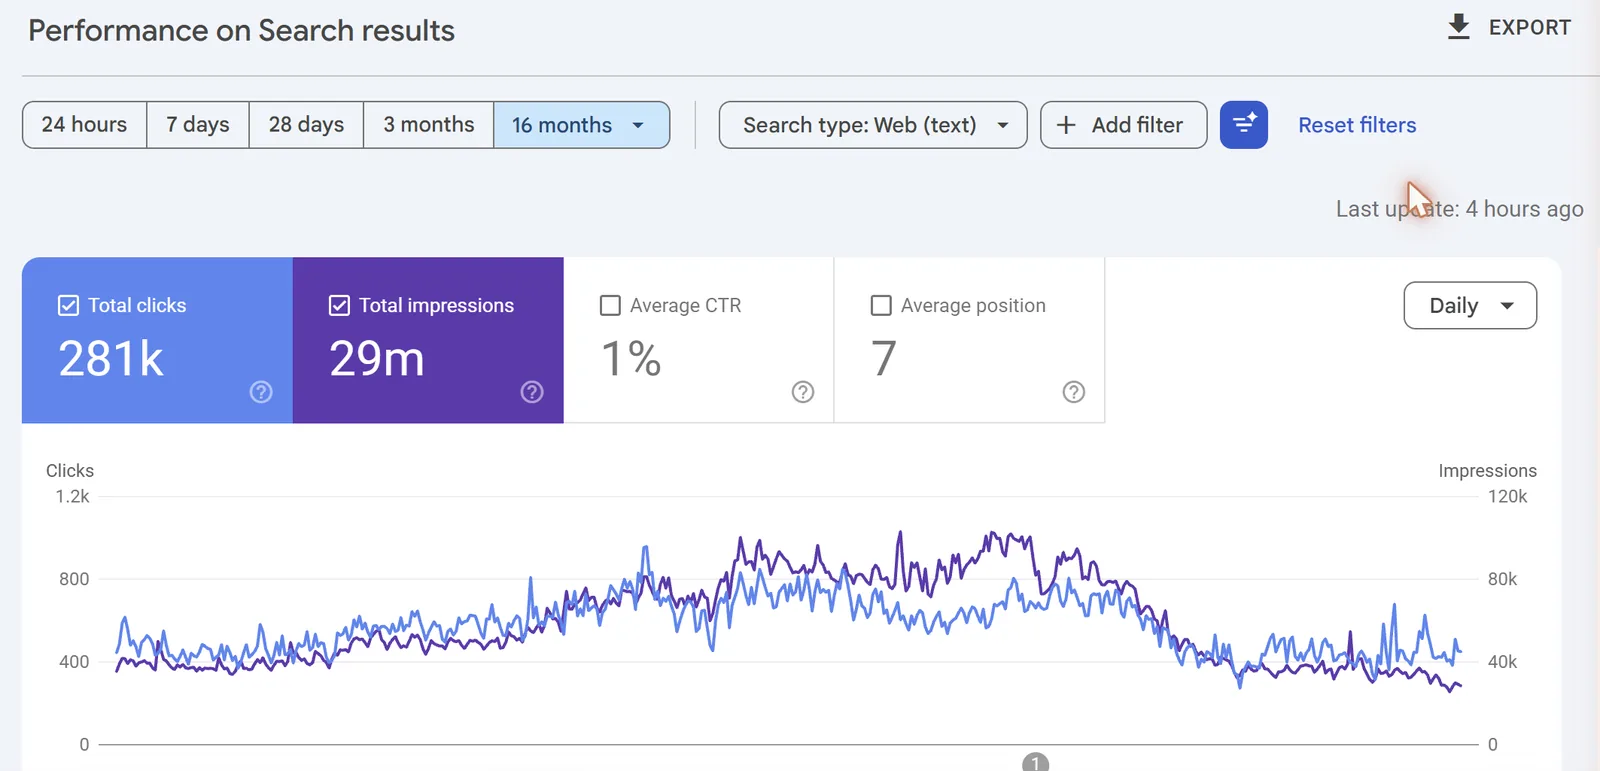
Reading the curve
Monthly clicks rose from 13,651 (Jun 2025) to 22,971 (Jan 2026), up 68%. The June 2026 step down is Google's May core update hitting blog posts. Product and collection pages kept growing through it.
We diagnosed it in the data, and sales held
What happened
Blog clicks fell from 553 a day on 21 May to 283 on 5 June, in Google's May core update window. 176 of 231 posts lost clicks; the top 10 made up half the loss.
What it was not
Blog impressions fell 63% while click-through rose from 0.65% to 0.85%. Google showed the posts less often. It was not AI Overviews taking the clicks, which changes the fix.
What held
Store pages kept growing. Organic conversions rose 4% while clicks fell 30%. July to August revenue: +24% year on year.
How we responded
- Ranked the losing posts and queued the top 10 for refresh, written to the brand's claims rules
- Kept store-page work first, so the update cost blog visits rather than sales
Search Console daily clicks; blog impressions exclude jump-link URLs, 23 Apr to 20 May vs 25 Aug to 21 Sep 2026. Conversions: SEO Gets (GA4). Revenue: GA4 Organic Search channel.
926K impressions inside Google's AI answers in 3 months
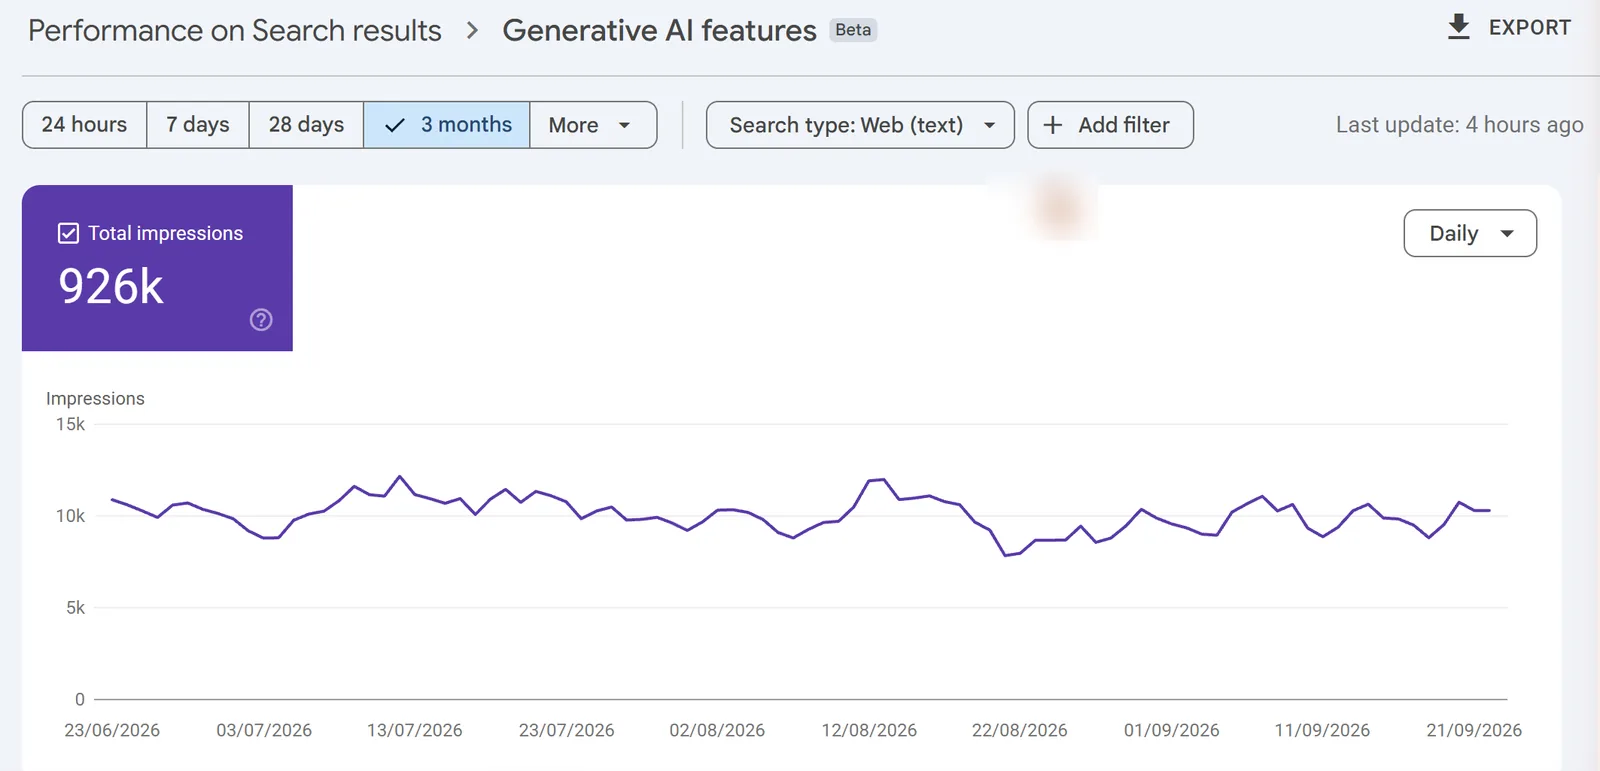
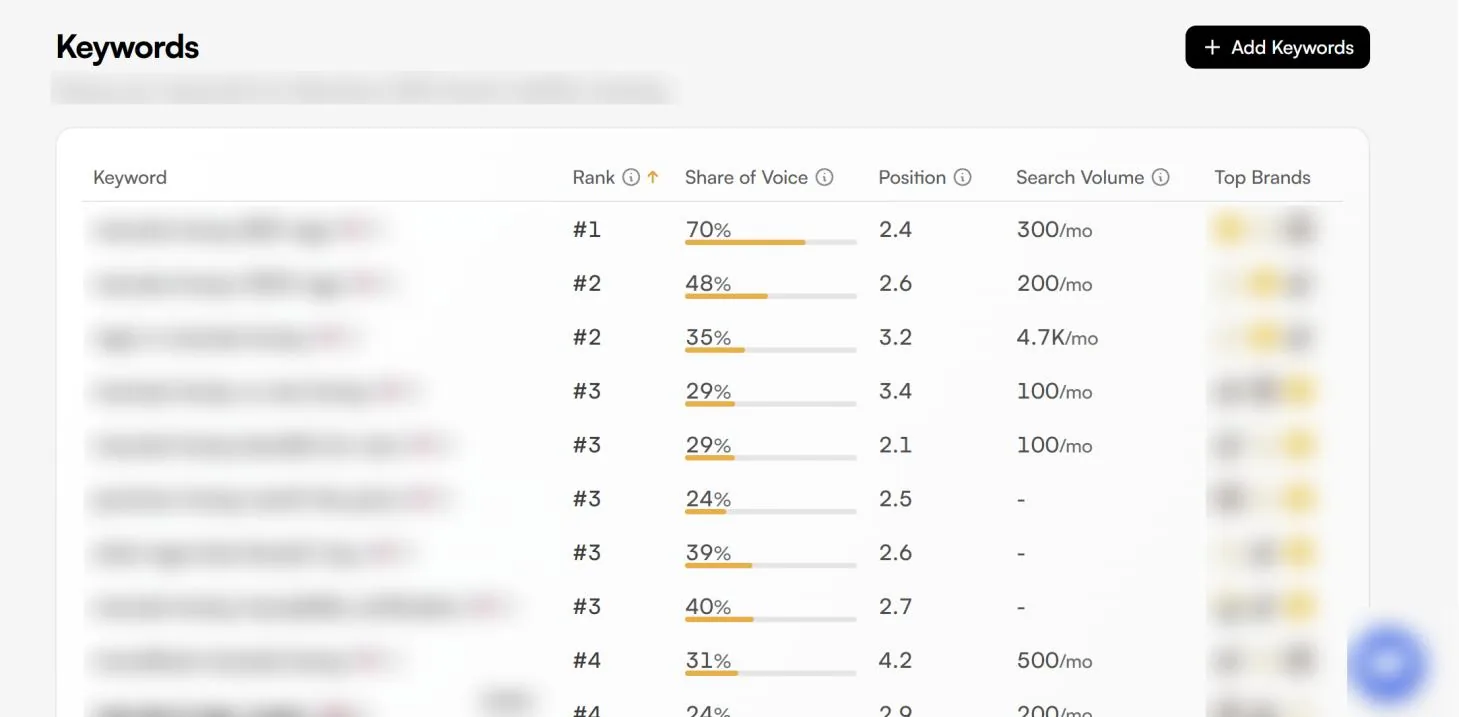
#1 in AI answers for the hero product
| Buying question (anonymised) | Rank | Share |
|---|---|---|
| Hero product grade | #1 | 70% |
| Next grade up | #2 | 48% |
| How the quality grading works | #2 | 35% |
| Product traceability | #3 | 40% |
| Which grade should I buy | #3 | 39% |
| Category head term | #5 | 26% |
AI visits: GA4 source/medium, 25 Aug to 21 Sep 2026 vs 26 Aug to 22 Sep 2025. ChatGPT shopping: GA4 chatgpt.com / feed.
Five workstreams, run every month
Foundations
Technical audits, indexing, structured data, speed, and analytics that track revenue and AI traffic.
Store pages
Collections and product pages first: titles, structure, copy and internal links aimed at buying searches.
Content engine
A 259-article library, refreshed every month, with new articles from researched briefs.
AI visibility
Answer-first rewrites and new pages built from what AI answers cite, tracked monthly.
Reporting
One monthly scorecard led by organic revenue, with clicks, rankings and AI visibility behind it.
Content that supports the store, shipped every month
How a refresh works
- Pick posts by lost clicks and revenue potential, not by age
- Rewrite answer-first so search and AI can quote it
- Check every health-adjacent line against the brand's claims rules
- Add links into the matching products and collections
- Track clicks, AI impressions and conversions after release
What it has earned
The four pages Google uses most in its AI answers are all blog guides. Rising guides include benefits (+112%) and quality grading (+263%) on the prior three months. Every post feeds internal links into the store pages.
Refresh log, blog feed and sitemap dates. Growing pages: SEO Gets clicks, 25 Jun to 23 Sep 2026 vs prior 3 months. AI pages: Search Console, 3 months to 21 Sep 2026.
A 533-URL audit, ranked by revenue impact
| What the audit found | Why it matters | Fix |
|---|---|---|
| 10 collection URLs rendered the same page, with no H1 or copy | The main collection's head-term listing dropped in May | Own template, H1, copy, FAQs |
| Product markup added only by JavaScript, no GTIN | Weaker product data for Google and AI shopping | Server-side schema with GTIN |
| 70 blog posts carried product-rating markup not shown on the page | Policy risk to review stars site-wide | Remove; add article markup |
| 94 of 119 pages-sitemap URLs were campaign or test pages | Crawl waste, thin pages in the index | Noindex and remove from sitemap |
| A footer link on all 421 pages redirected twice to the homepage | Wasted internal links on every page | Repoint to a live product |
| 82 blog posts had no links from other pages | Hard to find, hard to rank | 3 to 5 contextual links each |
| A second-market store copied 18 posts with no hreflang | International clicks fell by half | Hreflang or canonical |
Checked and ruled out: crawl errors, the SSL certificate and the cart page. We verify on the live site before we raise an alarm, so the dev team only gets real work.
Live crawl of 533 URLs and Search Console, 24 Sep 2026. Fixes are scheduled into the brand's site redesign.
Speed, indexing and tracking, measured on field data
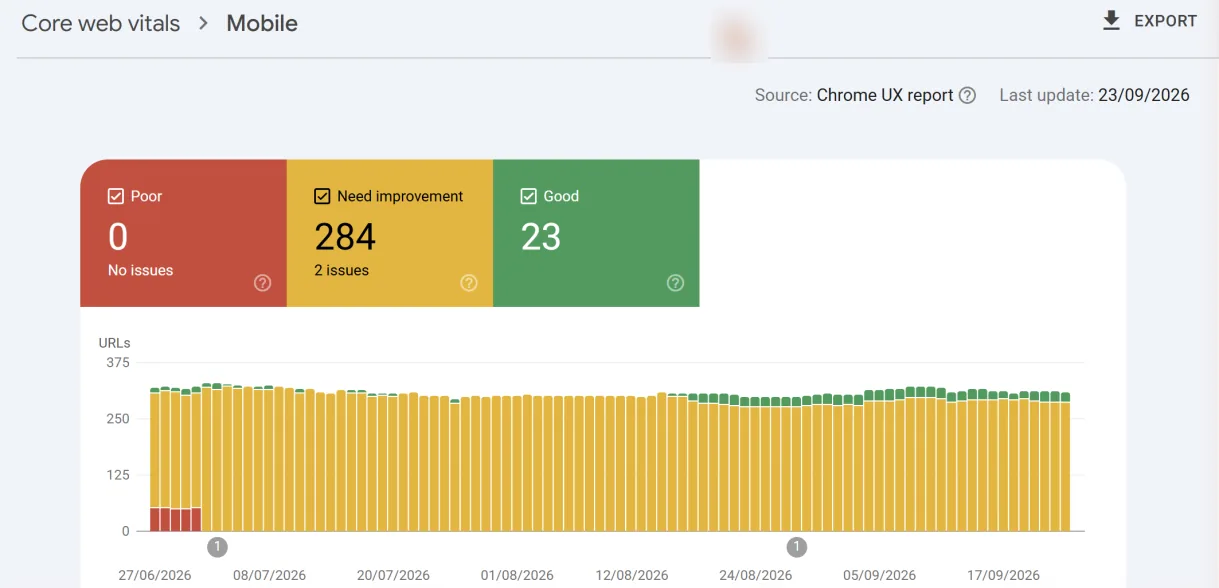
Indexing
668 pages indexed. Of the rest, most are expected (canonicals, redirects, noindex). The audit isolates the ones that matter: 102 404s and 108 crawled-not-indexed URLs, including key guides and products.
Tracking we set up and checked
- A GA4 channel for AI assistant traffic
- LLMrefs share-of-voice tracking on 39 buying questions
- Found 4,310 organic sessions and $6,536 hidden behind a Shopify pixel path
Search Console Core Web Vitals (updated 23 Sep 2026) and Page indexing (24 Sep 2026). Pixel path: GA4 google / organic, 25 Aug to 21 Sep 2026.
One monthly scorecard, led by revenue
This is the live scorecard for this brand: 25 Aug to 21 Sep 2026 against the same window last year. Each month it comes with the work shipped, what moved and why, and the next month's priorities.
GA4 google / organic (incl. free Shopping listings) and AI assistant sources; Search Console; LLMrefs 24 Sep 2026.
The plan to December: articles first, then the store pages
Next two weeks, then October
- Take the 32 in-pipeline articles live
- New collection template: H1, copy and FAQs
- Server-side product schema with GTIN
- Noindex test and campaign pages
- Fix the footer redirect and wrong titles
November
- No template changes in Black Friday week
- Refresh the 10 posts that lost most
- Link the 82 unlinked posts
- Fix links that point at redirects
- Agree the international store setup
December
- Mobile loading fixes on blog and product templates
- Expand AI tracking to 50 buying questions
- Monthly AI visibility report
- Q1 plan from December results
Store pages come first because November is the year's biggest month for organic revenue ($80,906 in November 2025).
What you get, month by month
Audit and plan
- Technical and store-page audit on your own data
- Analytics and AI traffic tracking checked and fixed
- A ranked fix list with the Shopify change for each
- Baseline scorecard: revenue, clicks, AI visibility
Ship and measure
- Store-page improvements and technical fixes, built by us
- Content refreshes and new articles from researched briefs
- AI visibility tracking on your buying questions
- Revenue-first report: what shipped, what moved, what is next
Re-plan
- Year-on-year review of revenue and purchases
- Next quarter's plan, timed around your peak season
- Targets agreed on clear, fixed definitions
Strategy from Rahul Bhatia (SEO and CRO, 14 years in search, focused on ecommerce). Build from Kapil Maheshwari (development and technical implementation). More on the team on our About page; the method behind this case is on Get Found.
Let's look at your store
Send us your store URL. We will come back with where organic revenue is being left on the table, and the first three things we would fix.
Get Your Free Growth AuditSee also: Credible backlinks · Free AEO tools · Pricing